


Qonnections 2018 was one of the best Qlik conferences I’ve attended. Qlik Sense dominated the conference and it dawned on me how Qlik has transformed with new vigor and spirit of innovation after Qlik Sense was formally introduced in late 2014.
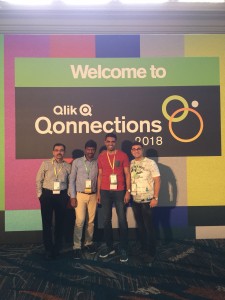 Being a Qlik Luminary, I was pleasantly surprised by the red carpet treatment by Viktoria Lindback and Gillian Farquhar. I am humbled to meet many Qlik Luminaries and MVPs during the Luminary reception and throughout the conference.
Conference kick started with CEO’s keynote speech. Mike Capone didn’t disappoint audience. He reaffirmed Qlik’s commitment to both QlikView and Qlik Sense. This is important for customers who have made significant investment in QlikView and are still on the fence evaluating Qlik Sense.
Qlik now has over 48,000 customers. That’s simply awesome and speaks volume about Qlik’s leadership in the analytics and business intelligence solutions. For a small increase in maintenance fee, QlikView users will be able to use same license for Qlik Sense. That’s smart strategy since out of 48,000 customers, 32,000 customers still use QlikView. This will make it easier for these customers to start leveraging power of Qlik Sense without incurring huge investment upfront.
The New Kid on the Block: Qlik Core
Qlik Core is an open source development platform built on top of the Qlik Associative Engine. With Qlik Core, you can take advantage of the powerful associative indexing engine from Qlik to build your custom data exploration and data visualization solutions.
Demo: https://ap.qlikcore.com
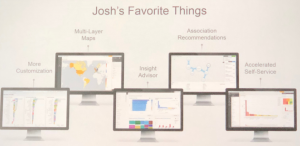
Josh Good’s Favorite Things
-
More customization: Set chart options; ability to apply themes
-
Multi-layer Maps: A new mapping object to render geographic data
-
Insight advisor : As an augmented analytics feature, Qlik Sense will automatically build charts based on statistically significant insight
-
Association recommendations: Associations not just based on the same field name but also based on the values
-
Accelerated self-service: As user drags a measure, Qlik Sense will create most suitable chart for that measure.
Cognitive Engine
Elif Tutuk, Director of Research, gave an awesome demo on augmented analytics using cognitive engine. It’s prime function is to enhance user’s analytics experience by taking data and turn that into insight in matter of seconds by leveraging visualization best practices and augmented intelligence. As you drag and drop dimensions and measures on the canvas or a chart object, cognitive engine will suggest best visualization.
In short, it’s integrated machine learning into Qlik Sense. This will be released in June.
Demo: https://www.youtube.com/watch?time_continue=1&v=OZKVA6OZWOA
Data Literacy
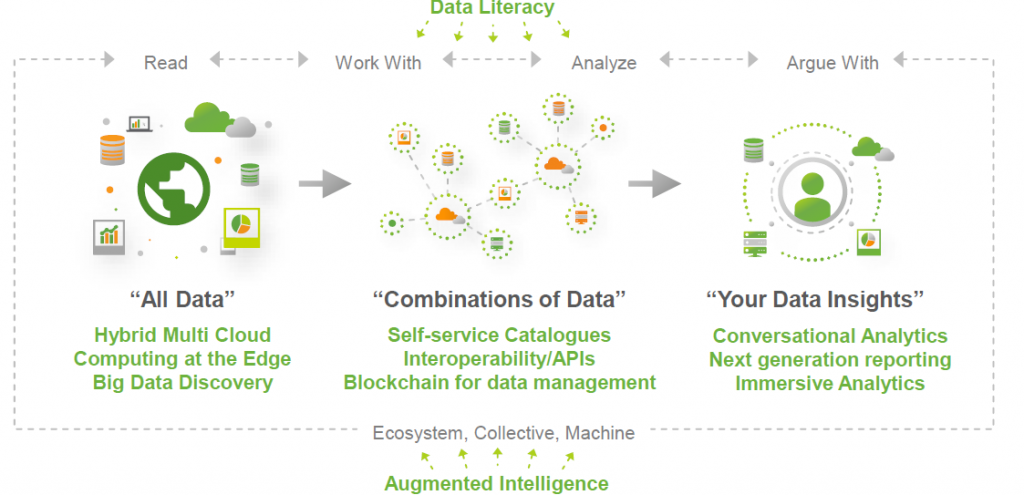
There was a great deal of focus on data literacy in this conference. As data growth continues at a rapid pace, consumers struggle with the ability to read, work with, analyze and argue with data. Data Literacy fosters data literate culture. Jordon Morrow, Qlik Global Head of Data Literacy, did an excellent presentation on importance of data literate workforce.
Jordon Morrow’s blog on Data Literacy: https://blog.qlik.com/jordan-morrow/
Qlik offers free courses on data literacy to foster education in a tool agnostic way.
https://www.qlik.com/us/services/training/data-literacy-program
Finally, big kudos to the best healthcare analytics team on the planet — Joe Warbington, Jeremiah Bonde, Dalton Ruer and Ann Marie Heil.
