


Both in QlikView and Qlik Sense, You can use equal sign in text objects, variable overview, chart expressions and/or labels. However, QlikView interprets equal sign differently depending on where you use equal sign in your QlikView application.
For example, a text object interprets text as a string without equal sign but requires equal sign if you intend to treat a text as an expression in the text object.
Similarly, a text in expression editor of a chart is treated as an expression implicitly so it doesn’t require equal sign but even if you use equal sign in the expression editor of a chart, QlikView still treats the string as an expression.
If you use equal sign in a variable definition in the variable overview, the expression will get calculated for the entire data set or the document. Instead, if you expect an expression for a given variable to be calculated for each dimension value in the chart, do not add equal sign in front of the expression while defining variable in the variable overview.
Let’s explore an example to make it easier to understand these nuances related to usage of equal sign in QlikView.
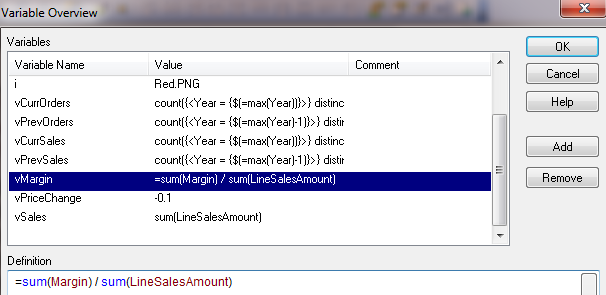
Assume that you are creating a sales application and it contains a variable to calculate margin for each product.
If you create a variable, vMargin, with equal sign in front of the margin expression, margin will be calculated at the document level.
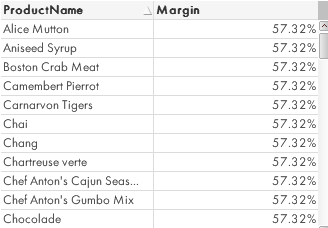
If you create a pivot chart and use vMargin with dollar-sign expansion, you will get following result:

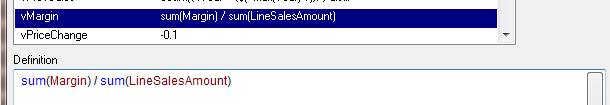
Obviously, this is not correct as each product has different margin. So, the trick is to remove the equal sign from the variable definition.
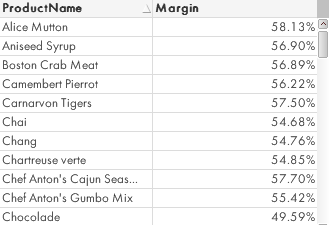
You will be pleasantly surprised to see that the pivot table now shows margin for each product as expected.
Problem solved!
Equal sign is very useful in both QlikView and Qlik Sense but knowing when to use it properly can save you from some heart burns for sure!
Next time, if you see same value for each row in your chart, you know the culprit!
