


Most businesses need comparative analysis to identify the state of the business. Qlikvew Alternate States was introduced in version 11 to facilitate comparative analysis such as year-over-year sales comparison where users want to see how current year sales compares to the previous year or current quarter compares to the same quarter a year ago.
You can perform similar comparison with set analysis syntax, but Qlikview Alternate States comes handy when you need to make different selections using the same dimension. Or, you want comparison of two charts or tables using several dimensions in the default state.
You can Detach an object such as a chart, so that object will not respond to any user selections. In that sense, it’s behavior is similar to an object in an Alternate States. However, there is a subtle difference between Detach and Alternate States.
All objects within a given state will respond to user selection made in that particular state. On the same token, same objects won’t respond to user selections made in the other state.
Before we dive into a Qlikview tutorial to see how Alternate States work, let’s understand two states that always exist in Qlikview document.
Default State: All Qlikview objects are in the default state and the state is represented by $ sign in the expression. All user selections are in the default state.
Inherited State: An object can inherit a state from the parent object(Document –> Sheet — Sheet Objects) unless overridden by the Qlikview developer.
Let’s explore an example to see how you can unleash power of the Alternate States for the comparative analysis.
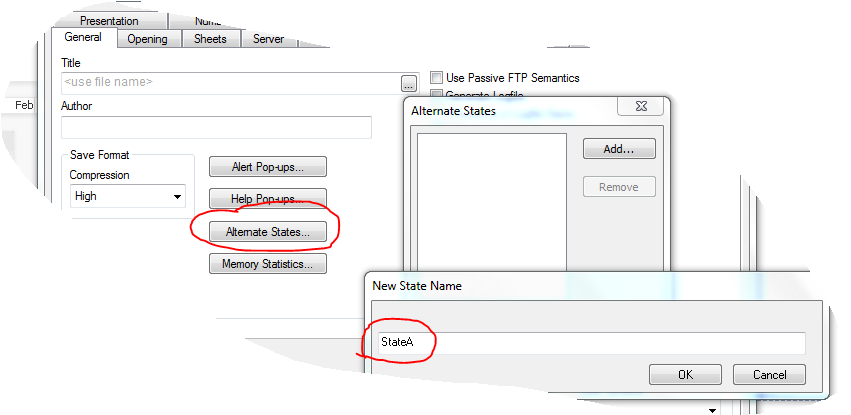
Step 1: Create two states — StateA and StateB
Settings —> Document Properties —> General
Now, let’s create two bar charts for the comparative analysis.
Step 2: Create two bar charts.
Set Alternate State = StateA for the first chart and StateB for the second.
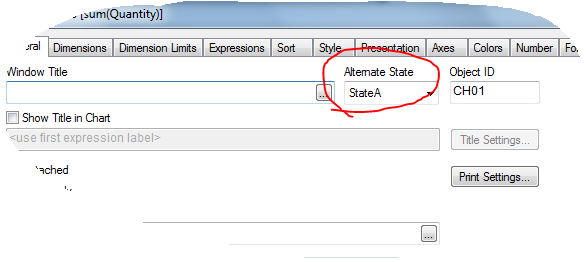
Chart 1:
Dimension = CompanyName , Expression = sum({StateA <SalesPerson =$::SalesPerson, CompanyName =$::CompanyName>}Quantity)
Chart 2:
Dimension = CompanyName , Expression = sum({StateB <SalesPerson =$::SalesPerson, CompanyName =$::CompanyName>}Quantity)
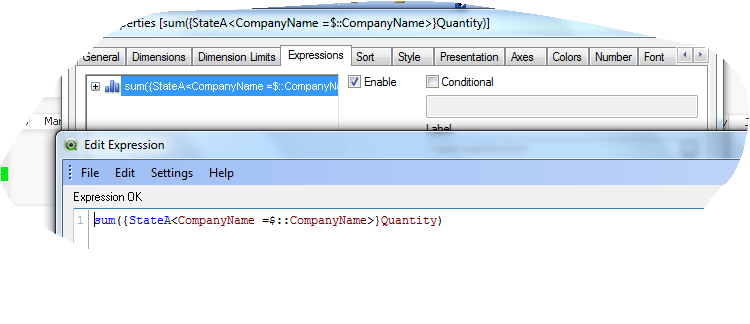
 Remember: As a best practice, make a habit to explicitly type state identifier in your set analysis syntax. Keep in mind that if you use $ as an identifier then it will override the current state(either StateA or StateB).
Step 3: Add year, month, SalesPerson and CompanyName selectors.
That’s it. Now, select different year and month for each chart and compare values. Notice that when you make selection for objects in StateA, those objects in StateB won’t respond to your selections.
Elsewhere:
![]()
Set Analysis and Alternate States — Quick Tip via Qlikboard.com
Qlikview Alternate States Part I via Learnallbi.com

Enmanuel 6:26 pm on January 4, 2014 Permalink
Hi
I made these examples with this great post (in spanish)
http://qlikviewapuntes.blogspot.com.ar/2014/01/ejemplos-set-analysis-en-estados.html
regards
Sundaramoorthi 9:48 am on February 18, 2014 Permalink
Hi shilpon,
Nice Explanation about Alternate state .
i applied in my Client Place . But they want to apply filter Globally, if required they will select individual chart
can you help me in this issues.
Jason 1:12 pm on October 28, 2014 Permalink
Hi shilpon,
This is exactly what I’m looking for. Great job!
Thanks,
Jason
QlikView Alternate States Use-Cases - Living Qlik 10:18 pm on October 8, 2016 Permalink
[…] to help lead users through the experience.Several people have written eloquently on this topic:Learn QlikViewQlikFixQlikBoardThere are probably other use-cases of QlikView alternate states I have not thought […]